
2025 Quarter 1 Commentary
Quarterly Commentary“We have two classes of forecasters: Those who don’t know – and those who don’t know they don’t know.”
-John Kenneth Galbraith
As we write this letter, President Trump has just released an unprecedented number of tariffs
across nearly all United States trading partners. It starts with an across-the-board 10% tariff, which
is lower than the 20% level he threatened earlier. From there, many countries are going to get an
adjustment that is higher than 10%. For example, on “Liberation Day,” the reciprocal additional
tariff on Chinese goods was to be 34% in addition to an already-in-place 20% tariff. Taiwan, the
semi-conductor manufacturing capital of the world, would get a 32% tariff in addition to 10%
blanket levies. The European Union would get a 20% tariff. These adjusted levels, which are well
above what the market
had been expecting, are
causing turmoil in
markets. These tariff rates
are of course subject to
change, sometimes daily.
As a matter of fact, the
current tariff on Chinese
imports has been updated
to 145%, with an
announced 90-day delay
on all other countries.
Since mid-February, we have seen nonstop new pronouncements and revisions to potential trade policy. This has led to higher levels of uncertainty. The U.S. Economic Policy Uncertainty Index has spiked.
This index has three main components. The first searches the top 10 U.S. newspapers for the volume of news on economic policy uncertainty. The second component checks for the number of federal tax code provisions set to expire. The third component looks at the level of dispersion or disagreement among economic forecasters about predictions on various measures of the U.S. economy. Now we appear to have a perfect storm of uncertainty, from federal tax codes sunsetting at the end of 2025 to frequent tariff announcements and tweaks, which in turn have led to even greater disagreement from economists about the potential impact on the economy. The net result is a level of uncertainty not seen since Covid.
The initial implementation of tariffs can have a short-term inflationary impact. However, longerterm implication of tariffs cause consumers to spend less, thereby slowing the economy. Just how much of an economic slowdown it might cause remains an open question.

Confusing trade policy tends to cause consumers additional worry. Both the Michigan Consumer Sentiment Index (MCSI) and the Consumer Confidence Index (CCI) have seen sharp declines over the past two months. Each index attempts to measure how Americans are feeling about their financial situations and their expectations. While each is measured differently, they both project that Americans are “tightening their belts.” It is important to note, however, that surveys are considered soft data because they rely on how people feel. Sudden news, such as a sharp rise in gas prices or announcements of widespread federal layoffs, can cause heightened concern.
For investors, higher levels of uncertainty result in lower stock prices. A higher level of risk means more discounting in the present value of businesses, which in turn is reflected by lower stock prices. At the end of the quarter, the Russell 100 Index, which is representative of large cap stocks, was down 4.5%. Other domestic indexes were down as well: The Russell Midcap Index was down 3.4% and the Russell 2000 Smallcap index was down 9.5% for the first three months of the year. Only those stocks outside the U.S. fared better.

The MSCI All Country World ex-U.S. Index was up 5.2% for the quarter. Uncertainty has grown from about mid-February through the end of March with all the tariff talk. This in turn led to a correction in U.S. stocks, which occurs when a market is down 10% from its high. While it appeared that domestic large and mid-cap indices had found some footing near quarter end, the announcements of extensive tariffs on April 2 have pushed the indexes down further. The rapidfire announcements have led to more and more uncertainty, fear, and confusion about what this means. Most people are not even sure if these tariffs are permanent or when and whether other countries will place their own tariffs on U.S. goods. The result is a sharp drawdown in equity markets in the U.S. and global markets.
When Not to Sell
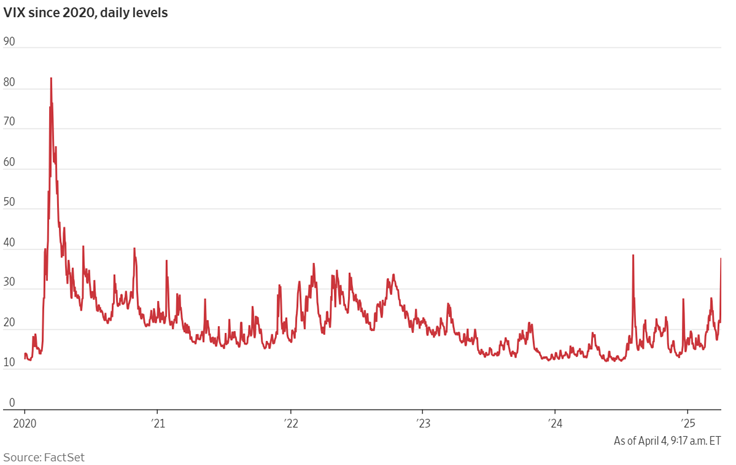
The lack of clarity about trade policy is driving fear in the markets. The CBOE Volatility Index,
which measures options volatility and is sometimes called the “Fear Index,” shows the equity
volatility reading at a level last seen in 2023 (see chart). One can see the spikes created during
Covid in 2020 and the banking crisis in 2008. High volatility typically means periods in which
the markets draw down
sharply and quickly. While
today’s readings are not
that high, they are elevated.
It is important to note that,
while it might feel safe to
exit markets when
volatility is high, it can also
lead to sub-optimal
investment results. The
problem with exiting the
market when storm clouds
gather is knowing when to
get back in.
To clarify the point further, we can examine different strategies on when to buy and sell the S&P 500 Index. In the following chart, many strategies are employed over 30 years, such as selling after any daily or monthly decline in the market or selling after a big daily/monthly decline (defined as 3% and 10%, respectively). These sell strategies are compared to a buy-and-hold strategy or even selling after the market goes up. The study shows that a buy-and-hold strategy outperforms all sell-afterdecline strategies. The two primary reasons that selling after bad news is usually worse than sitting tight are: 1) investors are selling after the bad news and stock decline, which is now already reflected in prices, and 2) investors are very likely to miss any recovery in stock prices.

Investing in equities should generally be done with a long-term view. Can businesses grow their values over time? In the U.S. and elsewhere, they have over decades. However, for shorter periods, stocks can decline, as we have seen in the first quarter and into the second quarter. It is important that investors do not make long-term decisions that are solely influenced by short-term circumstances. The adage remains true, “Time in the market beats market timing.”
It is also important to keep in mind that the overall picture for corporate earnings has been strong. For the fourth quarter, S&P 500 companies grew earnings at 18.2% from the prior year. Expectations are for double-digit growth over 2025. As company earnings grow, business values grow, thus offering support for stocks. When investors talk about “fundamentals,” that is what they mean. Sometimes the noise from headlines can drown out the fundamentals, but they still matter in the long run. It will be important as we move forward in the year to see whether earnings expectations decline due to higher tariffs, and if so, by how much.
Some strategists have revised their expectations downward for the year, but many continue to expect that the S&P 500 will rebound by that time. Recent recissions from the Trump administration surrounding tariffs, including a 90-day pause for most countries, gives analysts reason to believe that the most punitive tariffs are being used for bargaining purposes and may not be as widely implemented as first considered, or alternatively, that the administration can’t stomach sustained volatility for too long. For instance, in the above graphic, we see some substantive downward revisions at the start of the year but also revisions that imply an improvement in the S&P 500 until year-end.
Fixed Income
In times of market volatility, investors often rely on bonds (as well as real assets and alternative assets) as safe havens against wide value swings, especially when investors are distributing from and drawing down their assets. However, the circumstances of this volatility (uncertainty and tariffs) mean that at the same time equities are down, bonds are also fluctuating wildly. Bonds with longer maturities and durations are more subject to interest rate risk, meaning that when interest rates fluctuate a great deal, so do their prices, but even high credit quality and relatively shorter bonds are not free from the rollercoaster.
Ten-year yields continued to see the largest weekly increase since spikes after the September 11 terrorist attacks in the United States. In these market conditions, leveraged traders get sent to the sideline as the riskiest investors continue to sit out. See the graph on the following page for a comparison of how historic the recent sell-off has been.

Some of the speculation as to why rates increased at such a pace seems to be pointing to investors fleeing the United States’ treasuries as a reliable safe haven. However, others pointed to systemic possibilities as well. These include hedge fund activity, foreign investors selling U.S. treasuries, and basis trades unwinding. (We won’t go into details, but the basis trade involves speculators who bet on the price spreads between treasuries and futures.) This includes China, which is taking the brunt of the blowback from recent tariffs. Notably, foreigners account for approximately a quarter of total holders – Japan holds the most, while China and the UK are not far behind.
Regardless of the reason for the selloff, market participants were concerned about $22 billion in 30-year bonds being auctioned on April 10. If weak demand persisted, the possibility of yields surging even more was in play. However, the auction was well received with a high yield of 4.813% (slightly below the then-current yield), and participation was robust at 25.8%. Despite the good results, which avoided more pain, it did not spark a significant rally.

While inflation is running cool in the short term, pointing to more potential Federal Reserve cuts, long-term rates, which are subject to bigger fluctuations based on demand and other economic factors, are more malleable and can change on sentiment. This increase in these yields runs counter to a goal of the Trump administration to push down long-term rates. For the United States, the government believes a lower yield is desirable for the purposes of financing debt. They also believe that if long-term yields come down, the United States can benefit from financing debt at a much lower rate. Net interest payments are approximately 13% of U.S. expenditures and could become even more.
And although the United States cares about financing from this perspective, these yields also matter to individuals (and businesses) that need to finance larger purchases. The 10-year is tied to mortgage rates closely, as some individual lenders believe it can be used as a proxy for the ‘risk free rate’ with a spread. Therefore, when 10-year yields go up, so do mortgage rates. In April, for example, with the 10-year hovering around 5%, mortgage rates are just under 7%. Although mortgages are typically 30 years, their actual duration is much lower because people tend to retire the mortgage faster: they pay off their homes, sell their homes before finishing their mortgage, go through events like divorce that require selling, etc.

In addition to higher yields signaling risk, another closely watched metric of credit spreads has started to see some weakness. Typically, when measuring the difference between treasuries and riskier securities, like corporate bonds, spreads are tighter in times of economic certainty, but larger in times of volatility. While spreads have been incredibly tight over the last few years,
 the recent market activity has caused a selloff in riskier assets, prompting yields to increase on
these bonds. It is important to note that historically, these spreads are still relatively low. It will
be interesting to see how these factors play out over the next year, especially with tariff news
changing so rapidly. However, those who stuck with shorter-term yields have been rewarded for
now.
the recent market activity has caused a selloff in riskier assets, prompting yields to increase on
these bonds. It is important to note that historically, these spreads are still relatively low. It will
be interesting to see how these factors play out over the next year, especially with tariff news
changing so rapidly. However, those who stuck with shorter-term yields have been rewarded for
now.
Thank you and stay safe and healthy!