
2025 Quarter 4 Commentary
Quarterly Commentary“Far more money has been lost by investors preparing for corrections, or trying to anticipate corrections, than has been lost in the corrections themselves.”
Peter Lynch
Peter Lynch’s famous quote about market timing is particularly apt in today’s investing climate. From the start, 2025 stoked fears among investors of an economic slowdown following the Trump administration’s announcement of broad tariffs and their subsequent on-again, off-again implementation.
For several years, effective tariff rates across major global trading partners remained relatively stable. That ended on April 2, dubbed “Liberation Day,” when the White House announced massive 20% to 40% increases in tariffs on most countries’ imported products. While it appears the overall average has settled at about 10.7% – far lower than the initial proposal – it still represents a sharp increase from the 2.5% average in years prior.
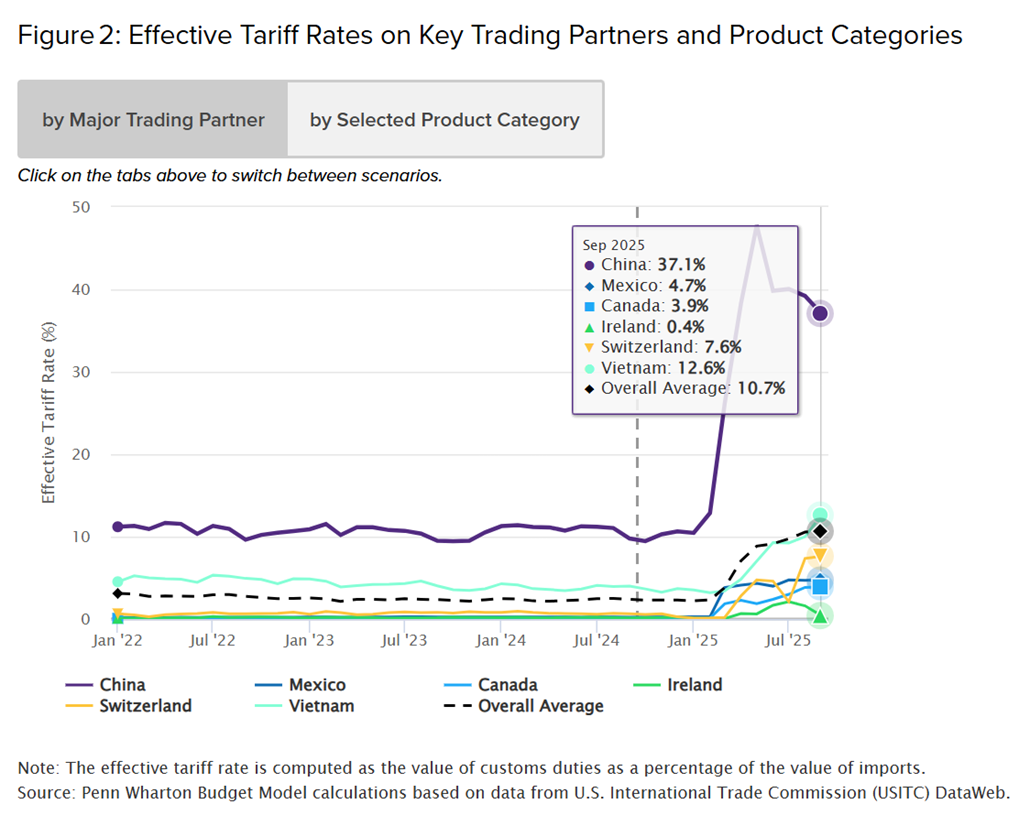
The specter of the new trade policy paradigm led to fears of a tariff-induced recession, which led to a market correction in April. At the time, investors expected retaliatory tariffs from trading partners, which could have led to lower supply and/or demand of goods.
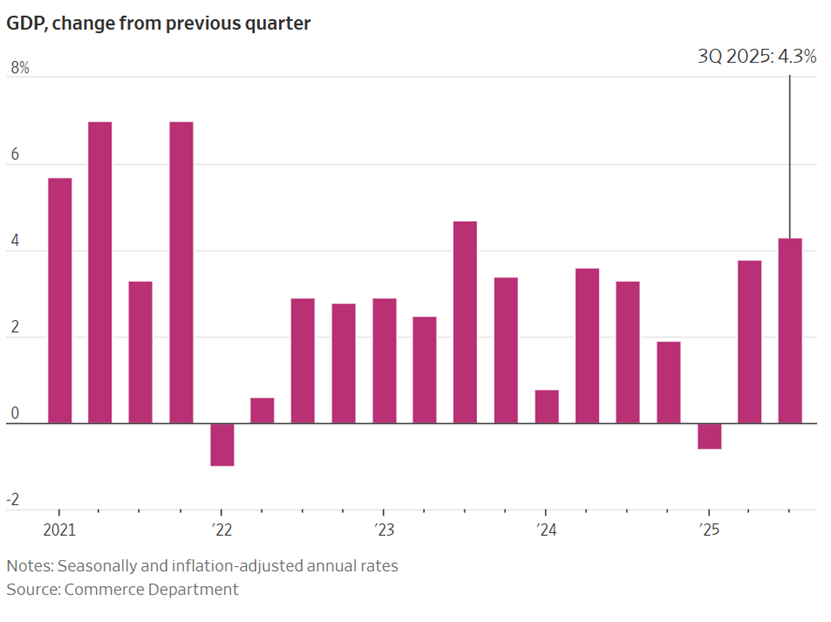
Later in the year, uncertainty was compounded by the longest government shutdown in history, running from Oct. 1 through Nov. 12. During this time, economic data releases were greatly curtailed, making the economic direction even more difficult to assess. When the third quarter Gross Domestic Product result was finally released in December, it showed unexpectedly strong growth of 4.3%, defying economists’ projections[i]. This followed another strong result in Q2, offering reassurance that initial fears caused by trade policy uncertainty did not materialize.
The unexpected market recovery, however, did not eliminate fears of ongoing risks. Two areas of concern are the labor market and inflation, and both issues tie directly to Federal Reserve decisions on the pace and timing of future interest rate cuts. The labor market has been slowing, with unemployment rising to 4.6%[ii]. While the economy has not shown signs of widespread job losses, job creation has weakened. In other words, those without jobs are finding it much more difficult to find one, and it is taking longer.
During a soft labor market, the Fed’s usual remedy has been to cut interest rates to stimulate the economy and encourage hiring. However, the counterbalance to the labor market has been inflation. Although well below the multi-decade highs of 2022, inflation has remained stubbornly above the “healthy” 2% target. Today, core inflation, which excludes food and energy, is in the 3% range, keeping pressure on the Fed to resist continued rate cuts that risk exacerbating inflation.
The Fed cut rates three times in 2025, but the meeting minutes show division on continued cuts. The Fed’s Board of Governors is awaiting additional data to provide clarity on both the labor market and inflation. Further rate cuts are likely if the job market worsens and/or inflation continues to trend down. If neither happens, we should expect a pause in rate cuts in 2026.
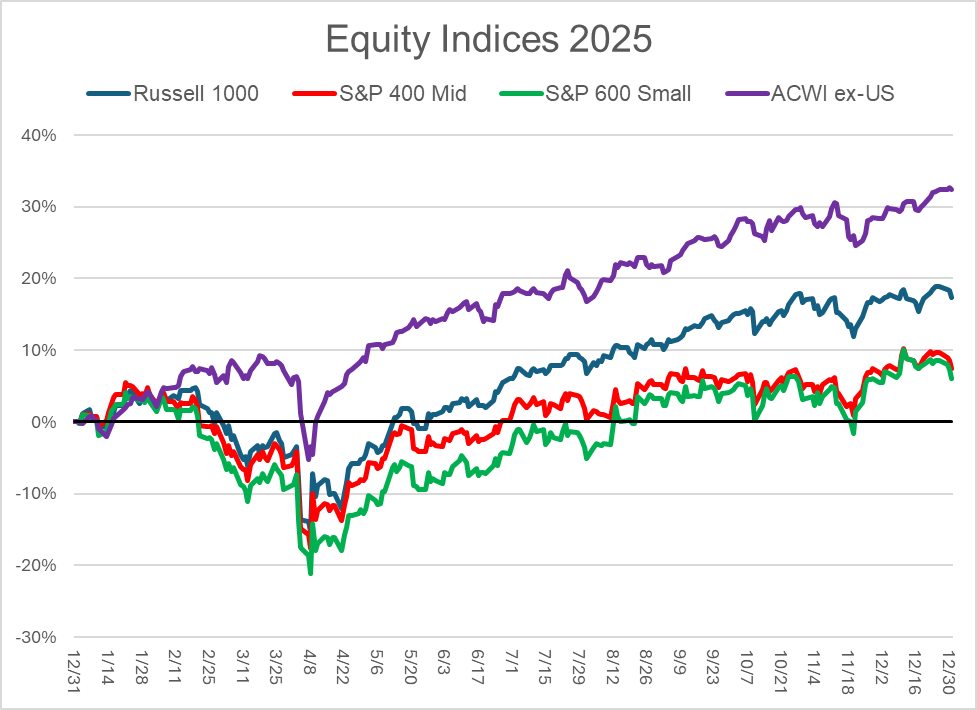
Equity investors enjoyed a fruitful year. The Russell 1000 Index, which is a broad measure of U.S. large cap stocks, finished the year up 17.4%. The S&P 400 Midcap Index returned 7.5% while the S&P 600 Smallcap Index gained 6.0%. Meanwhile, the MSCI All Country World Index (excluding the U.S.) returned 32.4% for 2025. Some of the factors that led to international stocks performing well in 2025 were: 1) uncertain U.S. trade policy pushing some investors toward international stocks, 2) the relative value in international versus domestic stocks, and 3) the weakening U.S. dollar.
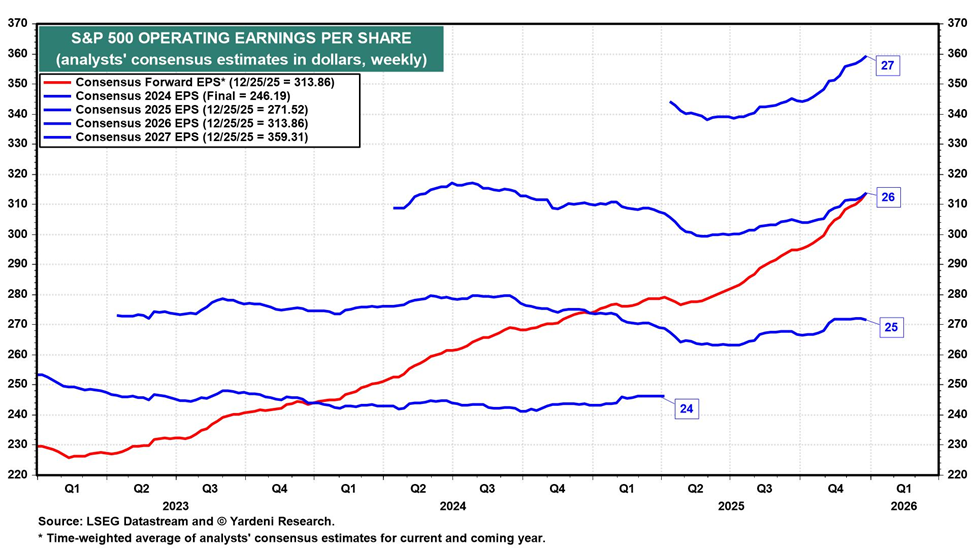
Corporate earnings remained resilient throughout 2025 – a key reason why stocks recovered from the April tariff-related swoon. Looking ahead, it appears that earnings growth is expected to continue into 2026, with operating earnings per share for S&P 500 companies projected to increase by 15% to 16%. The following chart shows individual calendar years in blue from 2024 through 2027. Notice how each line steps up from the previous year, indicating higher levels of operating earnings per share. Likewise, the red line, which measures the next 12 months of expected operating earnings at any moment in time, trends upward.
[1] https://www.cnbc.com/2025/12/23/us-economy-grows-by-4point3percent-in-third-quarter-much-more-than-expected-delayed-report-shows.html
[1] https://www.npr.org/2025/12/16/nx-s1-5645023/jobs-employment-labor-market