2026 Q1 Market Commentary
Quarterly Commentary“You want oil to live above $60 but below $90. Gas gets up over $3.50 a gallon, it starts to pinch. It hits $100, every product in America has to readjust its price.”
Tommy Norris, Landman
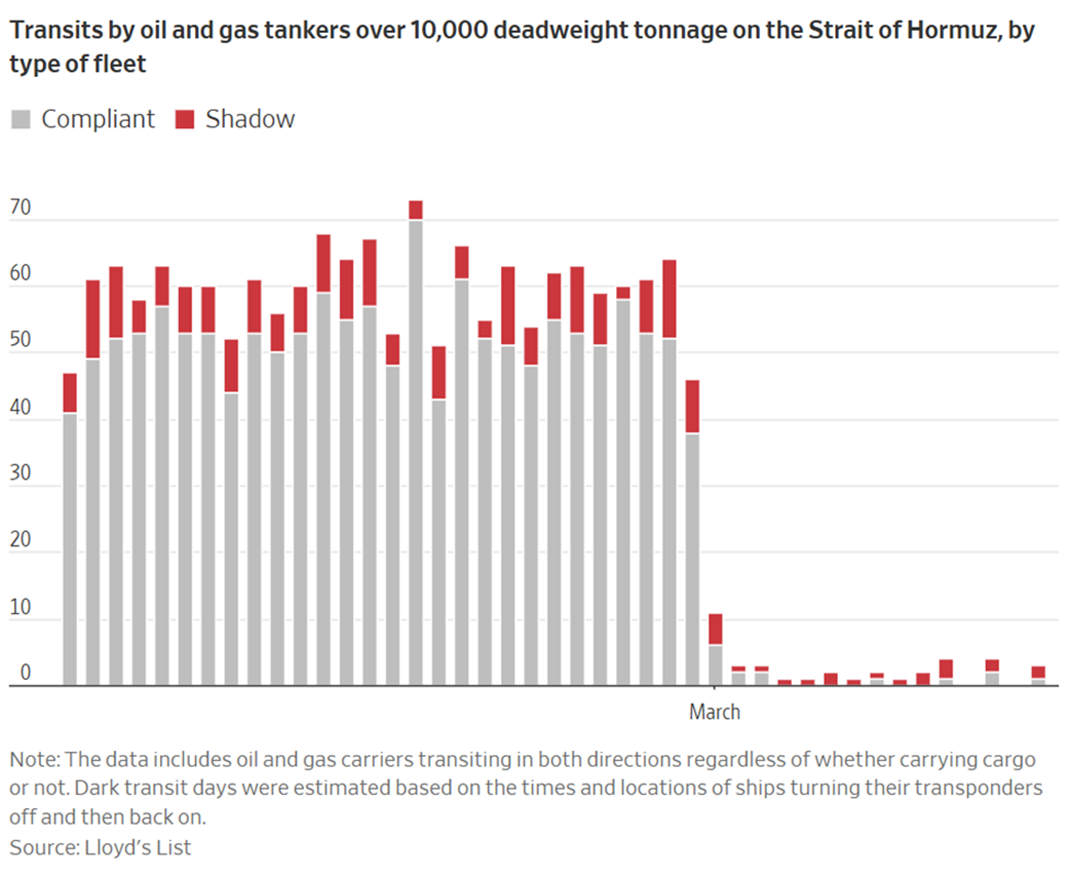
While the quote above is from a fictitious character in a drama set in the oil industry of the West Texas Permian basin, it does offer insight not only into the perspective of oil producers, but also the economy as a whole. As described by Billy Bob Thornton’s chain-smoking seasoned oil industry veteran Tommy Norris, producers are happiest when oil is priced high enough to generate profits, but not too high that it causes the economy to slow down. Oil prices have moved from $60 per barrel at the end of February to around $110 per barrel today. The single biggest factor driving up the price of oil is that tanker flow through the Persian Gulf has slowed to a near standstill. The chart below shows the clear steep drop off in tanker traffic once the fighting began. Iran, through the real threat of missiles, drones and sea mines, essentially has a veto on oil and gas tankers moving through the narrow Strait of Hormuz.
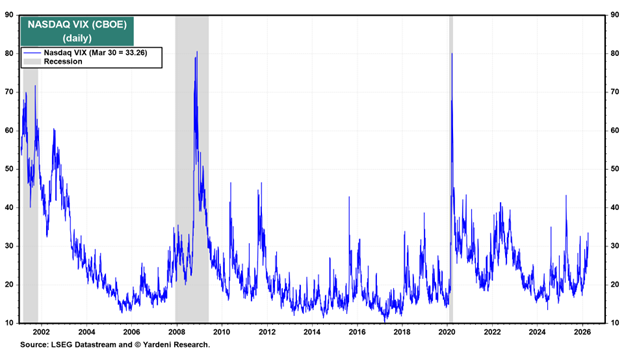
The increase in oil prices has naturally led to higher levels of uncertainty among investors, which in turn leads to higher market volatility. Because oil is such an important cost component for many businesses, the uncertainty of elevated oil can weigh on future earnings. The Volatility Index, or VIX, clearly shows that increased uncertainty playing out as the conflict continues.
While the higher level of uncertainty has led to a market pullback in March, thus far the overall impact has been muted. In addition, the end of the quarter saw a relief rally in equity markets and oil prices, as reports have surfaced that the administration is strongly considering ceasing hostilities on a shorter-than-anticipated time frame. The Russell 1000 Index, which represents U.S. large cap stocks, has fallen -4.18% in the first calendar quarter of 2026. The S&P 400 Mid Cap Index total return is 2.50%. The S&P 600 Small Cap Index is up 3.51%, and the MSCI All Country World Index excluding the US is down 0.71% for the quarter[i].
In addition to the Iran War, another major event happened back in January. The U.S. Supreme Court ruled that the administration’s attempts to implement tariffs under the International Emergency Economic Powers Act (IEEPA) was unconstitutional. The White House responded by implementing new tariffs under other legal provisions, but those tariffs have a 150-day limit. According to Yale University’s Budget Lab, the effective tariff rate in the U.S. before the Supreme Court ruling was 16%. With the switch from IEEPA tariffs to time-limited Section 122 tariffs, the effective rate is 13.7%. Once those tariffs expire, the effective rate will be 9.1%[ii]. While this rate is still higher than it has been in decades, it is moving in the right direction for reduced burden on global trade and should be viewed as positive for markets.
Looking ahead, Wall Street analysts still expect earnings growth for stocks. According to Factset, the estimate for total earnings growth among S&P 500 companies is 15.3% for 2026[iii]. The increase in the price per barrel of oil could possibly muddle that picture, but at this point, projections are still optimistic for solid growth among businesses. With respect to the immediate picture of 2026 first quarter earnings, growth expectations have pulled back slightly. Those results, which typically end on March 31st, but are reported in late April through June, have receded from initial estimates of 12.7% year over year growth, to an updated level of 11.6% growth. While these estimates still emphasize earnings growth, they do incorporate more uncertainty given the increase in oil prices through March.